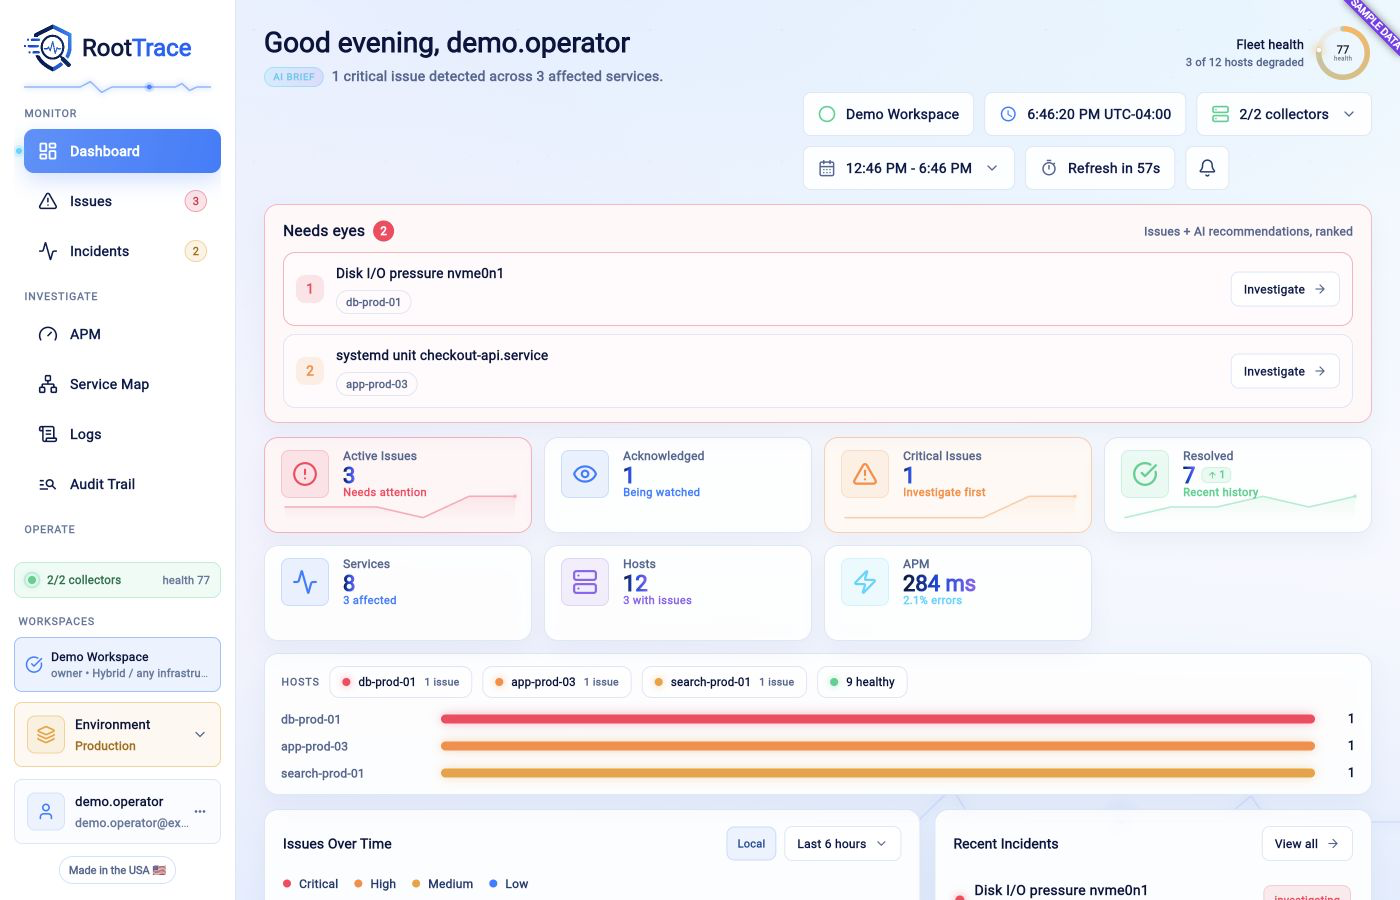
RootTrace connects Linux health, traces, logs, deploys, and past incidents in
one evidence trail. The same system can serve a single operator, several engineering teams, or a
global fleet.
RootTrace keeps each observation intact, then puts the useful relationships close enough to read.
Quietly. Until the pattern snaps into focus.
Symptom
The same failure keeps its history.
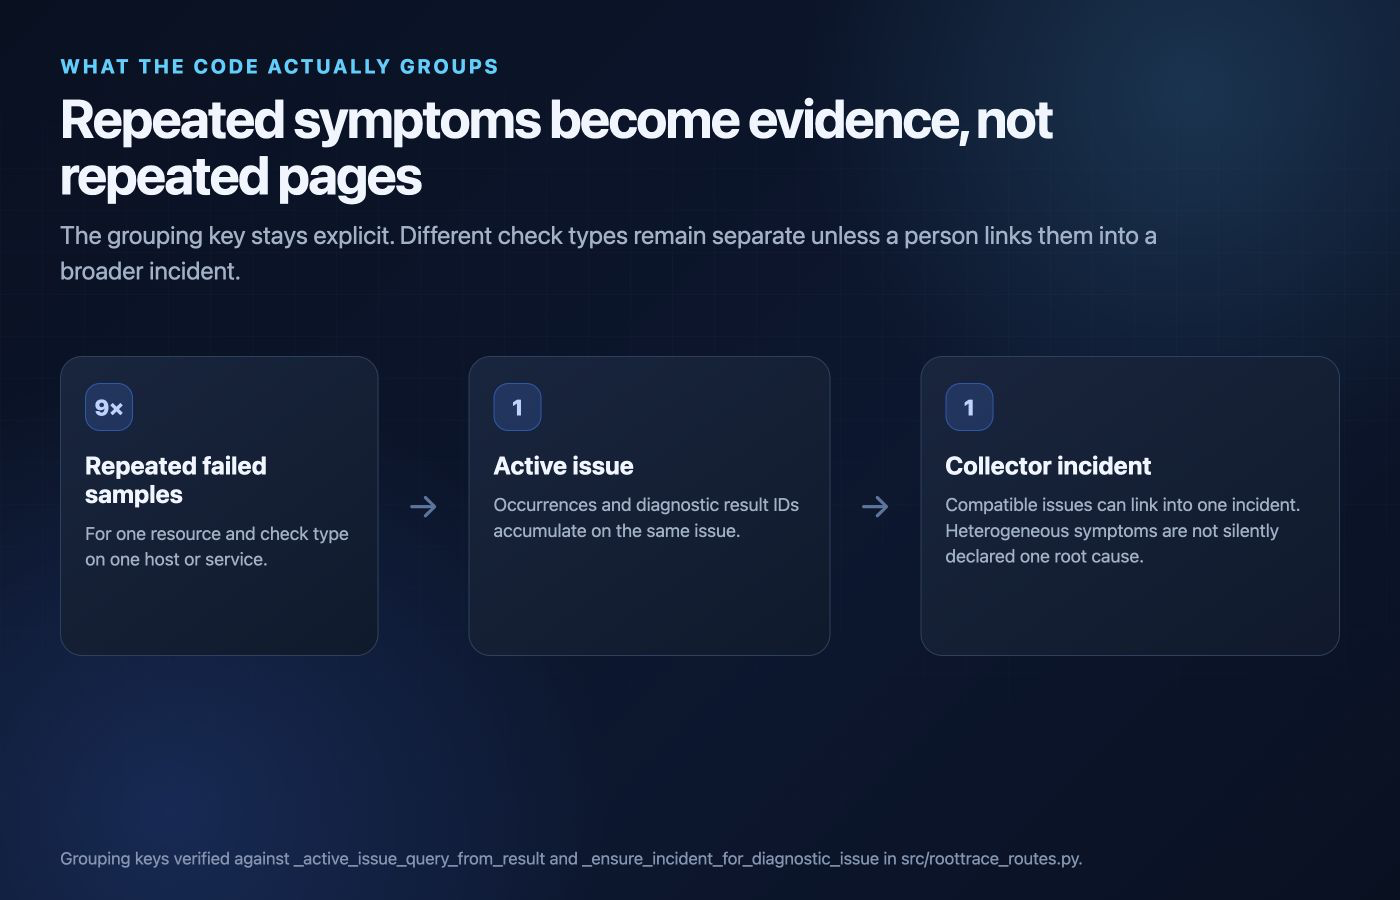
Repeated samples for one check and resource accumulate on one issue. Different checks
remain separate until an engineer links them.
Change
A deploy sits two minutes behind it.
Version changes, commits, host evidence, and trace errors share the incident timeline.
Cause
The regression narrows to code.
With enough traffic, RootTrace compares the hour before and after a version change and
shows which endpoint and span type became slower or busier.
Memory
The last fix comes back.
Elasticsearch can recall similar resolved incidents. Recommendations remain read-only,
and the linked record becomes a Markdown or PDF postmortem draft.
RootTrace reduces regrouping, timeline reconstruction, deploy comparison, and report assembly.
The first figure is a published estimate of the work at stake. The rest describe shipped product
behavior.
Published estimate60–90 min
Manual postmortem timeline reconstruction per incident. RootTrace keeps its issue timeline and
uses linked evidence to start the draft.
Read the source →
Issue grouping1 grouped issue
Compatible repeats update the same issue when workspace, environment, service, host, check,
and resource match.
Read the grouping rule →
Profile control~1 min
Active SDKs pick up a profiling toggle from the dashboard within a minute. No deploy or
restart is required.
Read the profiling guide →
Predictable billing0 ingest fees
Hosts and APM services set capacity. Spans, bytes, and launch-day traffic do not move the bill.
See plan capacity →
Follow the failure downward
From the request to the query shape.
Host diagnostics, APM, profiles, and database evidence meet under the same service and environment.
The joins are the product.
Deploy regression
See what changed after the version did.
Deploys, schema migrations, configuration changes, feature flags, and custom CI events land
on the timeline. Eligible regressions name the endpoint and span type that became slower,
busier, or both.
p95 latencycheckout-apiv4.12avg +212 msLive service map
Walk the blast radius.
Outbound HTTP telemetry maps internal and third-party dependencies with request volume, latency,
and failures.
checkoutinventorypaymentsshipping
Database cost
Rank the work worth fixing.
PostgreSQL and MySQL/MariaDB query shapes sort by total time, calls, mean time, or rows. Bind
parameters are removed, then redacted again before storage.
SELECT … FROM orders41.8%UPDATE inventory …23.1%INSERT INTO audit …8.6%
Linux, systemd, Docker, Kubernetes, AWS, databases, web servers, queues, HTTP, TLS, DNS, ping,
browser journeys, and auditd. A custom Python check joins the same thresholds, issues,
dashboards, and incident context.
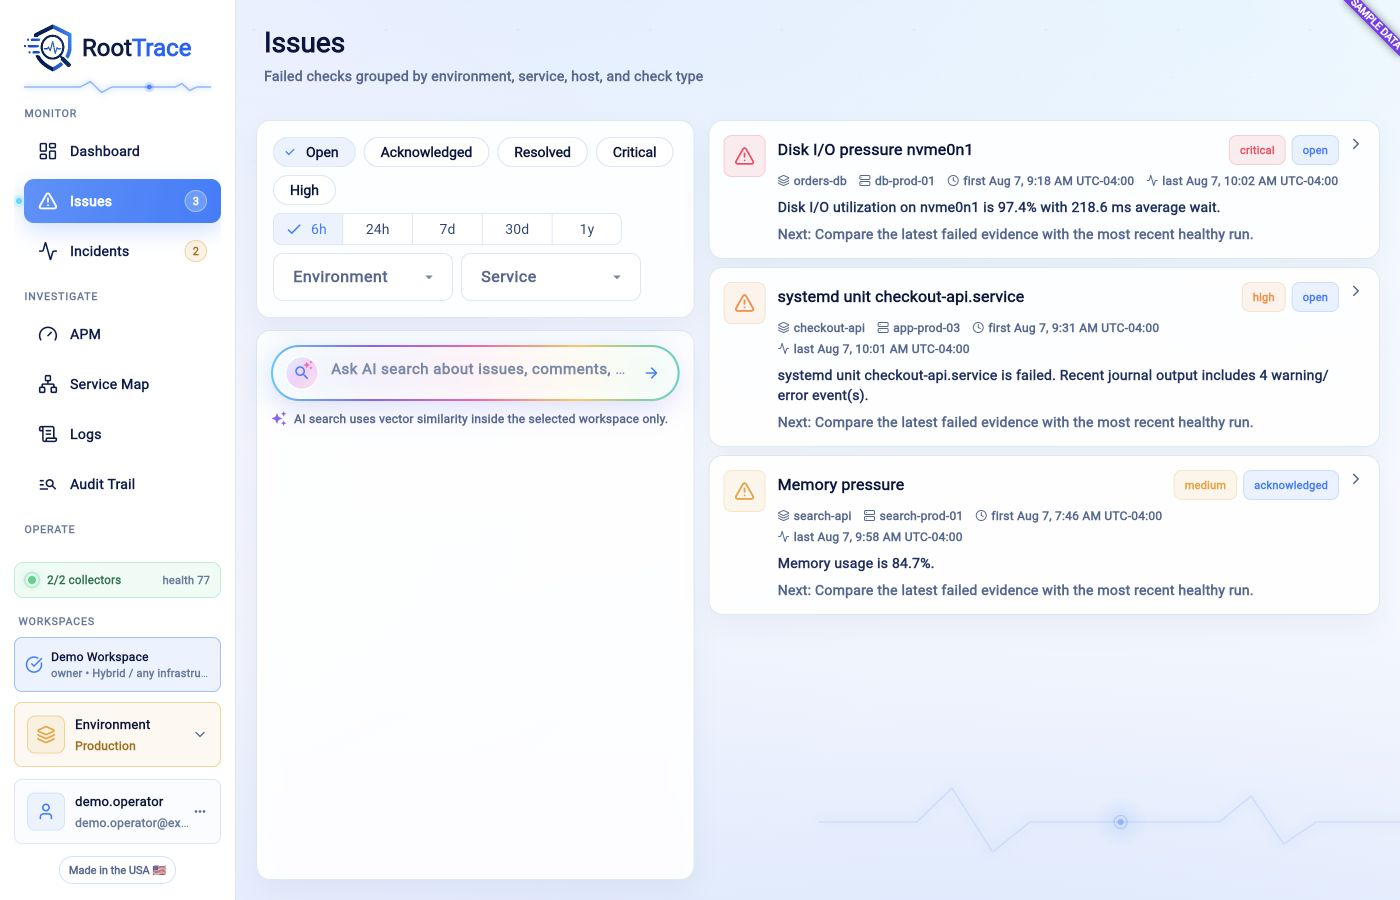
Every issue gets investigation guidance. External AI is optional; a deterministic local path
remains. Approval records a decision. It never runs a command.
Route lifecycle events to Slack, PagerDuty, Teams, email, or a webhook. Draft the review from
the evidence already linked.
Every transaction updates latency, throughput, error rate, and span time. RootTrace keeps the
slowest waterfalls and groups repeat exceptions by fingerprint.
RootTrace carries the signals around a failure, then keeps their links intact: the log opens the
trace, the SLO names the burn, and the synthetic runs from your collector.
Incident contextcheckout latency
LogsSLOChecksDashboards
01
Trace-correlated logs
Search logs, chart volume by level, alert on a match, and move between a log line and its trace.
The trace shows the request. The profile names the function.
CPU and wall-clock profiles remain separate. RootTrace ranks self time, turns
CPU samples into a capacity estimate, and compares profiles around a deploy.
Deploy diffHighlight functions whose share grew.
Dashboard controlEnable or stop profiling without a redeploy.
pprof ingestPost an existing profile without a RootTrace SDK.
Sample CPU self time projected over an average 730-hour month.
Sample data, not a customer result
checkout.serialize_order365.0 h/mo
pricing.apply_rules153.3 h/mo
tax.lookup_region65.7 h/mo
0.5 average vCPU×730 hours=365 vCPU-hours per month
Illustrative CPU profile · sample data. CPU and wall-clock profiles remain separate.
Runtime evidence
Security signals
Open · 3
Process spawn/bin/sh
checkout-api · v4.12.0
High · 3
Client, from trace203.0.113.47
Reported by host10.20.0.14
1
Request reached it
POST /api/checkout/redeemtrace e07c42b6…
2
Deploys just before
v4.12.0 deployedcheckout-api · 61 minutes earlier
3
On the host, around then
execve /bin/shauditd · uid 1001 www-data · within 15 minutes
Illustrative finding · sample data. Linux audit context appears when audit ingestion is enabled.
Runtime security evidence
When risky code runs, keep the request around it.
Python reports process spawning and unsafe deserialization inside requests;
Node reports process spawning. Java, Go, and PHP can mark the same call sites explicitly. Repeated
reports group into one finding with request and release context attached.
Also watched: persistent unfamiliar CPU call stacks and
unexpected profiling silence.
Observe, then investigate.
RootTrace does not block calls, capture request bodies or command arguments, or execute a response.
Production audit evidence. Search nearby Linux activity by actor, host,
executable, syscall, and outcome. Export evidence mapped to NIST, CMMC, DISA, and ISO controls;
the report states what remains your responsibility.
This command only downloads the image. The quickstart supplies Compose
and creates a bootstrap token. The first pull is nearly 6 GB; when it opens, you create one
local owner.
The same plans apply to hosted and licensed self-hosted deployments. Start free, then choose a plan
inside the workspace. Span volume and busy release days do not move the bill. Logs, continuous
profiling, database query monitoring and compliance evidence are part of the plan rather than
separate meters.
Choose a starting footprint
How many hosts do you expect to connect?
Pick the closest size. Plans can change as your fleet grows.
Suggested starting pointStartup · $449/month
25 hosts, 15 APM services, 5 users, and 90 days of retention.
For fleets beyond the standard plans, custom licenses set the users, hosts, APM services,
environments, integrations, and retention you need. Hosted or self-hosted.
SSO, SCIM, IP allowlists, service accounts, SIEM audit export, high availability, and air-gapped deployment.
Growth covers 100 hosts for $1,299/month and Scale covers 500 for $3,499/month.
Every tier is also available as a self-hosted licence at 20% less, because
you supply the hardware. Deploying another application costs $8 to $12 a month.
Sending more data from the ones you already have costs nothing.
Compare the plans ↓
Does RootTrace replace Prometheus, Grafana, or CloudWatch?
It can collect infrastructure, application, log, and reliability data itself, or run beside an
existing stack. Its main job is to connect checks, traces, deploys, incident history, and the
final postmortem.
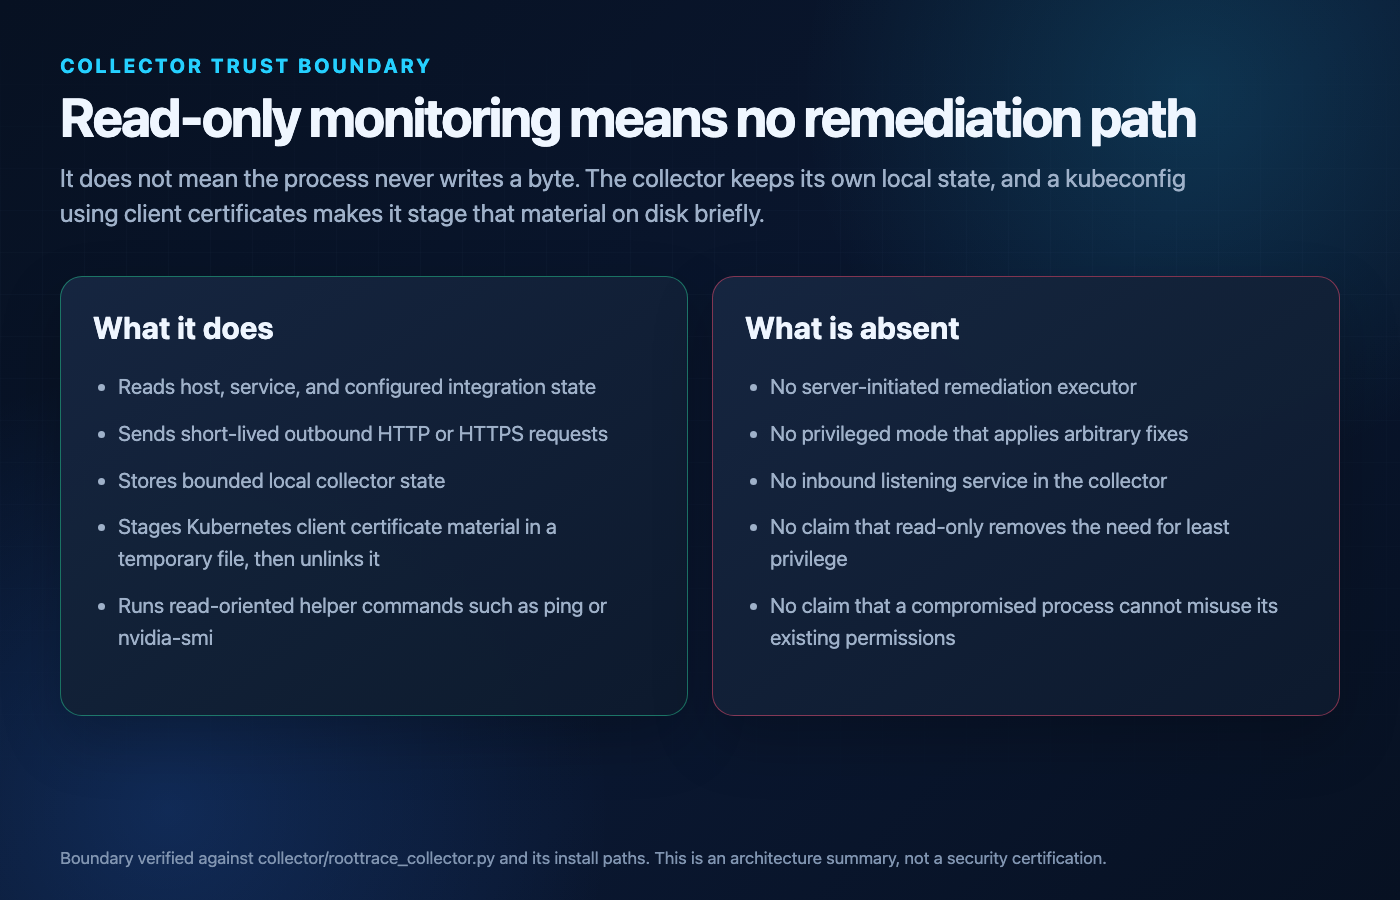
Can RootTrace change production?
No. The collector has no remediation executor and accepts no inbound commands. It reports to the
API URL you configure. Recommendations remain suggestions for an engineer to review.
Which APM SDKs are ready to install?
Python 3.9+ and Node 18+ are published packages. Go 1.21+, Java 11+, and PHP 8.1+ are available as
source implementations. OTLP JSON and protobuf work over HTTP; OTLP gRPC is unsupported.
What does the Free plan include?
Hosted: one user, 3 hosts, 3 APM services, 1 environment, 1 integration, and 14 days of
retention. An unlicensed self-hosted installation runs on 5 hosts with 1 day of retention,
on your own storage.
How long does setup take?
The local stack starts in about a minute after the first image download. That image is nearly 6
GB. The production Docker Compose installation is designed for about 30 minutes.
How do larger organizations manage identity and user lifecycle?
Paid hosted and self-hosted workspaces support OIDC, SAML 2.0, or LDAP, SSO-required mode,
group-to-role mapping, and organization-scoped SCIM 2.0 user lifecycle. SSO authenticates
existing users; SCIM provisions and deactivates them.
Does an audit export prove compliance?
No. Linux audit evidence can be mapped into reports for NIST SP 800-171 Rev. 3, CMMC, DISA
STIG/SRG, and ISO/IEC 27001:2022. The report shows captured evidence and remaining
responsibilities. It does not certify the organization.
Start with one operator. Scale across the organization.
Bring one noisy machine. See what RootTrace can explain.