
In 48% of Mandiant Cases, Detection Came From Outside
What request-context security signals can add, and where they can still fail
Across Mandiant investigations conducted in 2025, organisations detected the intrusion internally 52% of the time, according to the M-Trends 2026 Executive Edition.
In the other 48%, an external entity notified the organisation in 34% of cases and the adversary disclosed the intrusion in 14%.
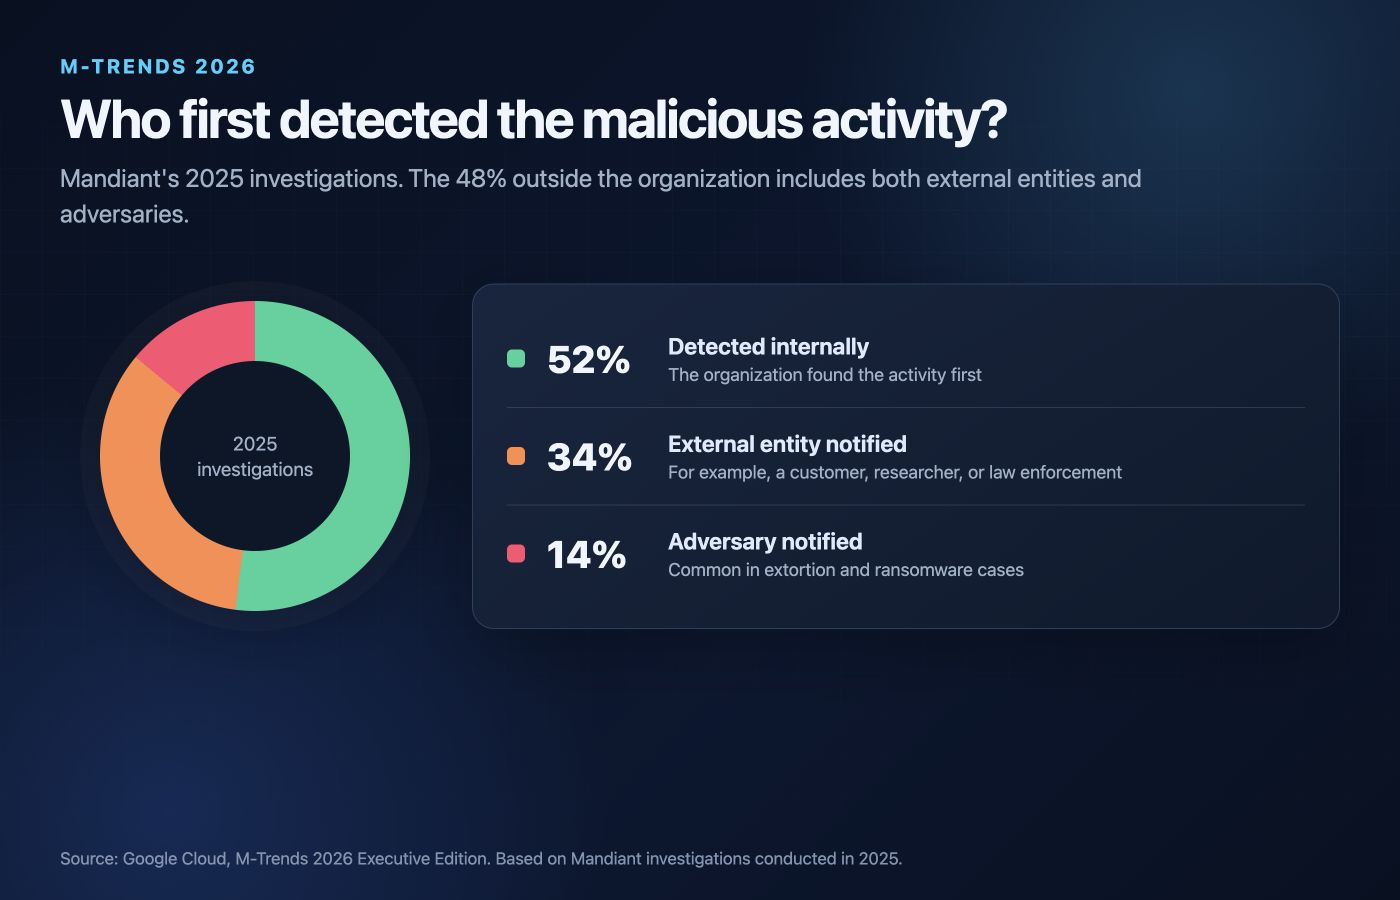
That statistic does not tell us why each intrusion was missed. It does make one question urgent: what evidence existed inside the application before somebody outside the organisation made the call?
A request that looks ordinary until it spawns a shell
Imagine a file-upload endpoint returns 200 at 03:14. The network layer sees an encrypted connection. The host layer sees python spawn sh, something a healthy automation process might also do. The access log sees a successful request.
Each layer can see something unremarkable because, at that layer, it may be unremarkable. One useful signal exists at the join: this shell was spawned during an HTTP request, by that endpoint, from that address.
Those records do not encode the join by themselves. Instrumentation inside the request can.
Sitting at the join
RootTrace reports from inside the request. The same SDK that times your code notices when it reaches somewhere an attacker needs it to go: spawning a process, deserializing untrusted bytes.
Because that happens inside a transaction, the report carries the trace id, the transaction name, the method, and the path alongside the executable. What it does not carry is an address, and that omission is deliberate: the process filing the report is the one that may already be owned, so a wrapper is forbidden from naming the caller. The address is joined afterwards, off the trace sample the SDK sent for that same request, which means it is there when that request was sampled and absent when it was not.
One address, not two. The join uses client_ip, the first X-Forwarded-For hop when present, falling back to the socket peer. remote_ip is that peer on its own, which behind a load balancer is the load balancer rather than the caller. The forwarded value is client-controlled unless a trusted edge proxy overwrites it, so it is a lead rather than an authoritative identification.
This is the difference between "a shell was spawned at 03:14 on web-04" and "POST /upload?f=1 spawned a shell, trace a41f, six minutes after deploy 251." The second does not end the investigation, but it narrows the first questions.
What it deliberately does not collect
Here is where the privacy trade becomes concrete, and it is worth being explicit about the choice RootTrace makes.
The executable is recorded. The arguments are not. Not truncated, not redacted, not stored encrypted. Never captured.
The reasoning is in the source, in almost these words: an attacker's argv is the exfiltration. The command line of a malicious process routinely contains the data being stolen, the credentials being used, or the payload being staged. Capturing argv to help you investigate a breach means building a database of the most sensitive strings that ever crossed your systems, and then being responsible for it.
Same reasoning, further down the list: no request bodies, no SQL text, no file contents.
You lose something real here. There are investigations where argv is exactly what you wanted. We think a tool that hoovers up command lines is a worse risk than the visibility it buys, and you should know that is the choice rather than discovering it later.
The bit that is genuinely awkward
Three of the five runtimes require an explicit wrapper, and the reason is interesting enough to be worth your time.
In Python and Node, a library can replace subprocess.Popen or child_process on the module object at import. The RootTrace SDKs use those hooks for automatic coverage of calls that pass through the patched entry points. Code that cached a reference before instrumentation or bypasses those APIs can escape the hook, so "automatic" is not the same as tamper-proof or universal.
PHP cannot. exec, shell_exec, proc_open and unserialize are internal functions, and userland cannot redefine them. Extensions such as uopz and runkit7 can alter runtime behavior, but RootTrace does not require a debugging extension or rewrite source as it is included.
Java cannot either, cleanly. Intercepting ProcessBuilder needs a -javaagent and bytecode instrumentation at class load, and a dependency has no business turning itself into an agent.
Go has the same constraint for a different reason: os/exec resolves at compile time, and a library cannot replace it without source rewriting or unsupported linking tricks. So in Java, PHP, and Go you call the reporting wrapper yourself. That is less convenient, and it keeps the instrumentation boundary explicit.
Three more design notes
A thousand probes is one finding. A campaign against an endpoint groups into a single finding carrying a thousand occurrences, rather than a thousand rows. The queue stays a queue.
Findings outlive the telemetry. They keep the audit trail's retention rather than your plan's telemetry window, so the evidence does not expire exactly when somebody starts asking questions.
It does not block anything. This is not a WAF and never becomes one. A false positive that takes down your checkout at peak is worse than the attack it prevented, and we would rather be a witness than a gate. It is also not tamper-proof: the reporter lives inside the process it watches, so an attacker with code execution can silence it. Reports leave on the normal flush cadence to narrow that window, and a service that goes quiet while still sending metrics is itself a signal.
Worth checking on whatever you run
Ask your current stack one question: if an instrumented service spawned a shell inside an HTTP request right now, which tool would connect those two facts?
If the answer is "an analyst would, given the logs and time," you have identified a correlation step that could delay detection. The M-Trends number describes Mandiant's investigation set; it does not prove that this specific gap caused those external notifications.
Reproduce the signal on a test endpoint
The server image is public and the free tier needs no vendor account or licence key:
docker pull public.ecr.aws/byteaffinity/roottrace/server:latestThe pull alone starts nothing. The quickstart is one paste-able block that writes the Compose file and your bootstrap token, then docker compose up -d. Drop the Python or Node SDK into a disposable service and spawn a harmless process from a test request handler. The useful product test is whether the finding gives you the request, trace, and executable without capturing the arguments or request body, and whether the calling address turns up from the sampled trace rather than from anything the reporting process asserted.
RootTrace is self-hosted monitoring and incident intelligence for teams. Intrusion signals come from inside your own code, telemetry never leaves your network, and it is free on five hosts. roottrace.io