
Your MTTR Is Only as Honest as Its State Machine
How soft failures, unresolved outages, and unknown time change the number
Imagine the monthly reliability review shows a 54-second MTTR. It looks like a win. Then someone asks how a team that had two long incidents resolved the average one in under a minute.
The answer is hiding in the state machine. A check failed once at 03:14 because a disk flushed and a health endpoint took four seconds instead of two. It passed again at 03:15. Nothing was wrong. Nobody woke up. Nothing was resolved, because nothing broke.
If a tool records that as a one-minute incident and averages it in, repeated blips pull the mean toward the check interval.
Do that a few hundred times a month and your MTTR converges on the length of your check interval. The dashboard looks fantastic while the two incidents your team actually remembers disappear under hundreds of blips.
An MTTR number is only useful when the product can show what it counted.
What we count instead
RootTrace uses the soft-state and hard-state distinction documented by Nagios. Prometheus expresses a related idea through the optional for pending period: a condition can remain pending before it fires.
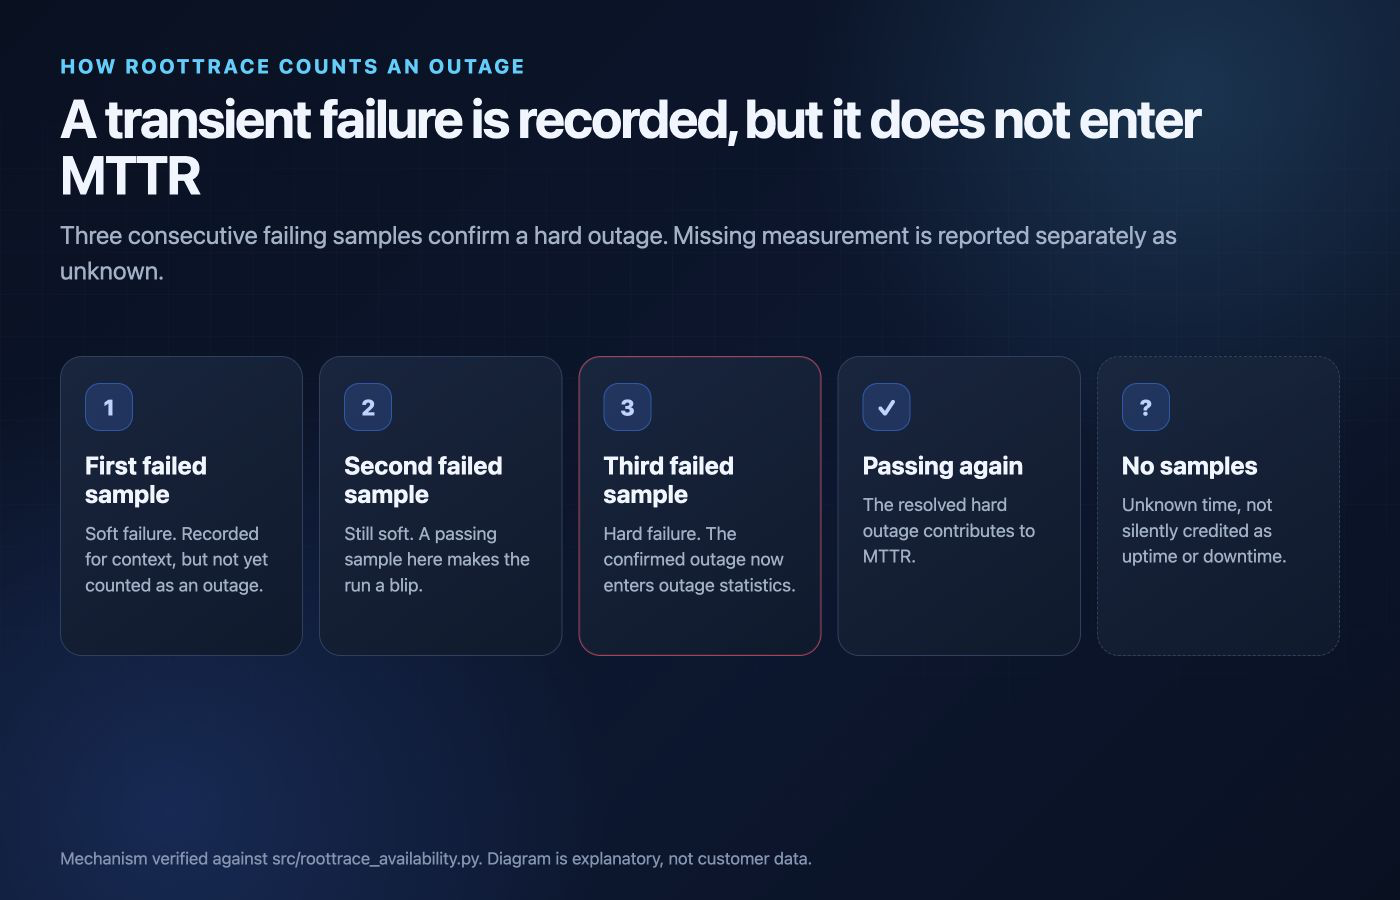
A failing check starts soft. RootTrace defaults to three consecutive failures before confirming an outage. Until the configured max_check_attempts is reached, the samples remain a blip. They are recorded, but they do not enter the outage statistics.
"Recorded" is carrying real weight in that sentence, and it is worth being exact, because you will notice it the first time you try this. RootTrace opens an issue on the very first failing sample. The threshold governs what counts as an outage, not what you are allowed to see. Visible, investigable, and excluded from the statistics are three separate decisions, and a single "is this an incident" flag collapses all three into one.
The code says so out loud:
A run that never reached max_check_attempts is a blip, not an outage.
Counting blips would make MTTR trend toward zero and stop meaning anything.
That is the actual docstring on the function that computes MTTR, MTBF and outage counts. The threshold is explicit in the input rather than hidden inside the calculation.
Two other choices prevent the display from implying more than the data knows.
An outage that is still running is left out of the mean. MTTR averages resolved outages only. If you are two hours into an incident right now, the current duration appears in longest-outage, but it does not enter the average until the outage ends. This avoids biasing the mean in either direction.
A window with nothing to average returns no number. Not zero. Zero would read as "we resolve everything instantly," which is the opposite of "we had no confirmed outages this month." Those are different facts and they get different answers.
The denominator matters too
Here is another failure mode. Your collector stops reporting for forty minutes because the box it runs on was rebooted for a kernel patch.
What was your availability during those forty minutes?
The honest answer is: unknown. You were not measuring. Carrying the last known state forward would turn a gap into an assumption, so RootTrace records the gap separately instead.
RootTrace records that gap as unknown and reports it separately. It is Nagios's "% Time Undetermined", and it exists because a monitoring system that cannot distinguish "fine" from "not looking" is not measuring availability, it is measuring its own uptime.
This is also why availability comes as three percentages rather than one, each labelled with the assumption it makes: the raw figure, the figure over measured time only, and an adjusted figure that excludes announced maintenance and time attributed to an upstream host dependency. Showing all three makes the reporting choice visible.
Two MTTRs, because there are two questions
There is infrastructure MTTR (how long confirmed outages lasted) and there is issue MTTR, measured from when an issue was first seen to when it was resolved.
They answer different questions. The first is about your systems. The second is about your team and your process: how long between something being visible and somebody closing it out. A team with excellent infrastructure MTTR and terrible issue MTTR has a triage problem, not a reliability problem, and collapsing both into one figure hides exactly that.
What this changes for the person on call
None of this guarantees a larger or smaller number. It gives the person in the review a defensible answer. Soft failures remain visible as evidence, confirmed outages drive outage statistics, unresolved time stays out of the mean, and unmeasured time is labelled unknown.
The reasoning is simple. An MTTR you can quote in an SLA review has to survive somebody asking what went into it. If the answer is "every transient sample we ever recorded, plus a guess about the minutes we were not watching," the number does not survive that conversation, and you will find out in the meeting rather than beforehand.
That is the RootTrace value in this story: the dashboard does not merely show a number. It preserves the distinctions needed to explain the number when the meeting becomes uncomfortable.
What to check in your own tooling
Whatever you run, three questions are worth asking it:
- Does a single failing sample create an incident? If yes, your MTTR is at risk of measuring check intervals rather than confirmed outages.
- What happens to time when the agent was not reporting? If it silently becomes uptime, your availability is optimistic by exactly the amount of time you were blind.
- Does an in-progress outage affect the mean? If it does, your MTTR improves while you are still on the call.
If your tool answers those well, good: the number is worth something. If it cannot answer them at all, that is worth knowing before somebody asks you to defend it.
Run the state-machine test yourself
RootTrace runs on your own machine, free on five hosts, with no vendor account and no licence key. The image is on a public registry:
docker pull public.ecr.aws/byteaffinity/roottrace/server:latestThat pull on its own starts nothing, so be honest about the next step: the quickstart is a single paste-able block that writes the Compose file and generates your bootstrap token, with nothing to edit and no placeholders. Then docker compose up -d.
Budget more time for the image download than for writing the configuration. The server image carries its own embedding model.
Run a check that fails once, recovers, and later fails enough times to cross the configured attempt threshold. Then open availability history and verify that the first event remains evidence without becoming a confirmed outage. That small test tells you more about the product than a polished MTTR tile.
RootTrace is self-hosted monitoring and incident intelligence for teams. It runs on your own hardware, keeps monitoring data in your stack, and is free on five hosts. roottrace.io