Turn CPU Profile Time Into a Monthly Capacity Estimate
Why RootTrace refuses to price wall-clock samples as CPU
Checkout latency rises after a deploy. Distributed tracing tells you a request took 412ms and that 210ms was inside an application span. Useful. Then somebody asks the follow-up and the trace has nothing left to give: which of our code was slow, and how much capacity is it consuming?
Traces stop at the span boundary. That boundary is exactly where the interesting part starts.
The gap between "slow" and "actionable"
A span tells you a region of code took some time. Inside that region there might be forty functions. The trace knows about none of them, because instrumenting every function call would cost more than the thing it measures.
So the usual path is: notice the slow span, guess, add timing around the guess, deploy, wait, and look again. Every weak hypothesis can require another change and another observation window.
A profiler shortens that loop by sampling stacks instead of requiring a timer around every function. On runtimes where the SDK can measure CPU, it ranks where sampled CPU time accumulated. On the others it reports wall-clock samples and does not relabel them as CPU.
Diffed against the window before it started, not against nothing
Open a flame graph cold and you are looking at a picture of your program. It is interesting. It is not an answer, because you have no idea which parts are normal.
RootTrace opens the profile from an issue already diffed against the same length of time immediately before that issue started, ranking the functions whose share of the profile grew. The comparison is anchored on the issue, not on a release: the deploy timeline sits beside it in the same view, so a version that shipped into that window is one glance away rather than one tool away.
That reframes the question from "what does this service spend time on" (a research project) to "which frames grew when this started" (a ranked comparison). It does not prove which frame is the bug, and it does not attribute the change to whatever deployed nearby. It gives the investigation a narrower place to start.
Frames are recorded as module.function, deliberately without line numbers, so a function that got slower reads as the same function across a deploy rather than as two unrelated frames because somebody added an import at the top of the file.
A number a capacity decision can use
Self time, summed over a window, converts to vCPU-hours per month.
That can turn a profiling finding into a decision. "This serialization function is 29% of the profile" is an engineering observation. "At this measured rate, this function projects to 140 vCPU-hours a month" is a capacity estimate that can be compared with the effort to fix it. It is not a cloud bill: converting the capacity to money still requires your actual infrastructure and pricing.
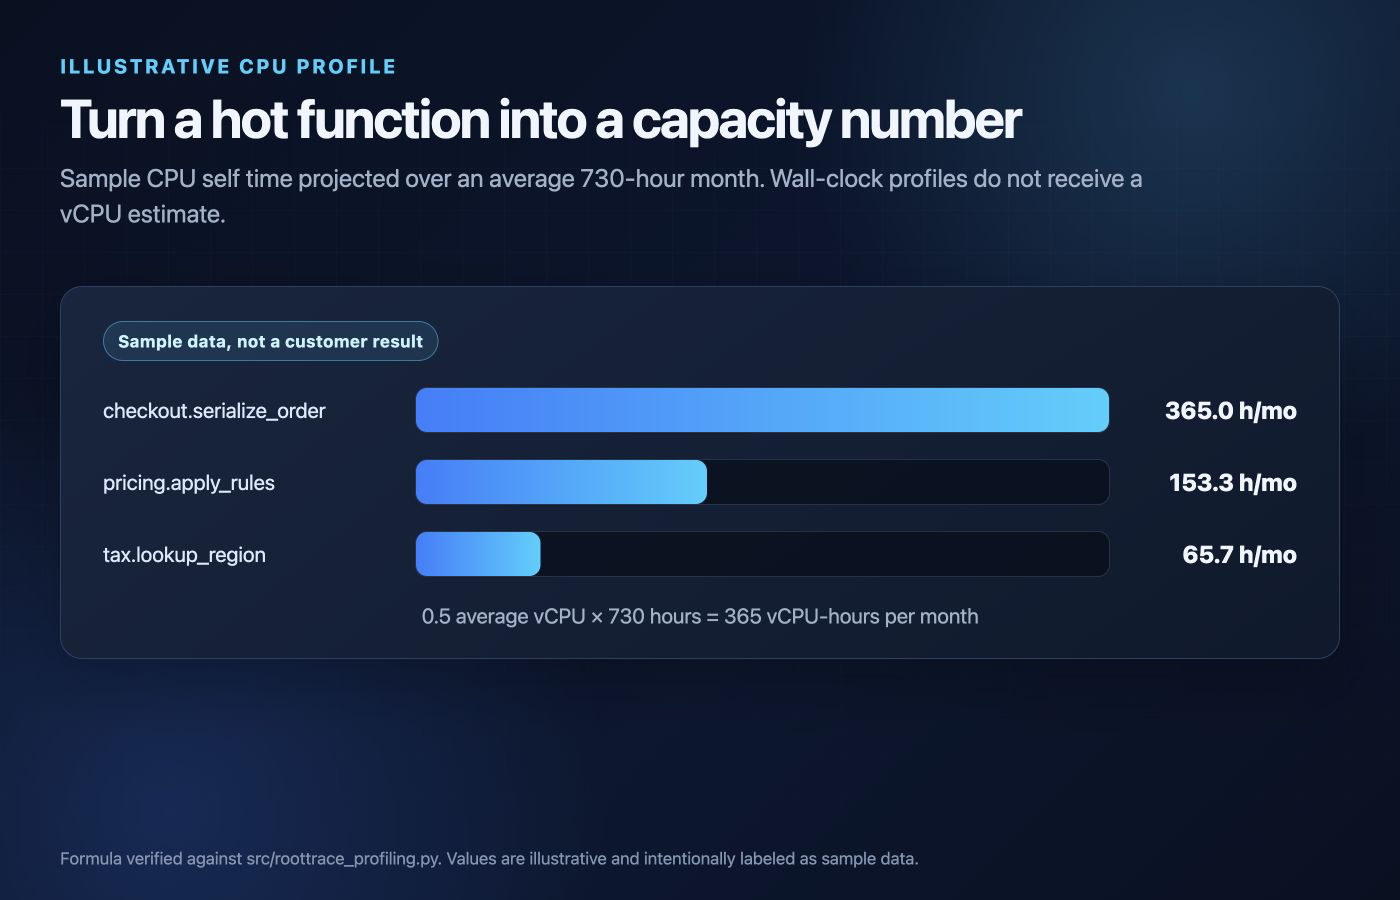
For a wall-clock profile the capacity estimate returns nothing at all. Not zero, not an approximation with a disclaimer. Nothing. A wall-clock sample can include time blocked on I/O, so treating all of it as CPU consumption would overstate capacity.
The multiplication would work. The number would render. It would be wrong, and somebody would put it in a capacity plan.
Which brings us to the harder question
Not every runtime can give you CPU time, and this is where the runtime limits matter.
Node gets real CPU time, from V8's own sampling profiler over node:inspector. Samples are weighted by V8's timeDeltas rather than hit count, so a stall shows up as the stall it was instead of being averaged into the nominal interval. (idle) is excluded, because counting the event loop waiting as CPU would put every idle process at 100%.
Python does not. CPython's CPU-accurate mechanism is setitimer(ITIMER_PROF), whose signal only ever reaches the main thread, which is useless in a threaded web server. So the profile is wall clock, and it is labelled wall clock. Nothing calls it CPU time.
Java does not in the current SDK either. The CPU-sampling mechanism is JFR's jdk.ExecutionSample, and consuming it in-process needs RecordingStream from JDK 14, while the SDK targets 11. So it samples Thread.getAllStackTraces() across every thread, and calls the result what it is.
PHP needs an extension, ext-excimer, and that is not a shortcut. The language has neither threads nor userland timers, so nothing inside a request can interrupt it. Sampling has to come from the engine. Without the extension, profiling reports itself unavailable and every other part of the SDK carries on.
Go will decline entirely if something else already holds the CPU profiler, net/http/pprof or a test harness or a competing agent, and say so. There is one per process and it is not ours.
CPU and wall clock are never merged or relabelled. Each profile says what it measured and what it could not see. That is less impressive on a feature matrix and considerably more useful at 3am, when the difference between "this function burned CPU" and "this function waited" is the entire diagnosis.
Two operational details
It is off until you turn it on, per service, from the UI. Which means turning it off during the incident it is causing is a toggle rather than a redeploy.
It fails closed, and clamps every sampling bound independently of the server. A compromised or spoofed control plane cannot talk your process into spinning a sampling loop.
Worth asking your current profiler
Does it tell you what it measured? If a tool reports "CPU" on CPython or on JDK 11, ask how. The implementation matters because sampling capabilities differ by runtime and version.
Produce one profile you can challenge
docker pull public.ecr.aws/byteaffinity/roottrace/server:latestThe pull alone starts nothing. The quickstart is one paste-able block that writes the Compose file and your bootstrap token, then docker compose up -d. Add the Python or Node SDK to a disposable service, enable profiling for it from the UI, and put it under controlled load for a few minutes. Then check the profile type before looking at the capacity estimate. A CPU profile should produce vCPU-hours; a wall-clock profile should refuse the conversion. That contrast is the product demonstration.
RootTrace is self-hosted monitoring and incident intelligence for teams. Continuous profiling that names the function and says what it measured, running on your own hardware. Free on five hosts. roottrace.io